How to Choose Full Spectrum LED Plant Grow Lights for Commercial and Vertical Farm Applications

How to Choose Full Spectrum LED Plant Grow Lights for Commercial and Vertical Farm Applications
Commercial and vertical farm procurement decisions for LED plant grow lights require a different analytical framework than hobbyist purchases. The scale of investment, the operational lifespan of the system, and the direct link between lighting performance and crop yield mean that specification errors compound into significant financial consequences over a 5–10 year operational period. This guide covers the complete decision framework: technical specifications, application-specific requirements, certification standards, and comprehensive cost analysis.
How to Choose Full Spectrum LED Plant Grow Lights?
What Are PPE, Uniformity, and Thermal Management?
These three specifications form the foundational evaluation criteria for any commercial plant grow light procurement:
PPE (Photon Photosynthetic Efficiency, µmol/J)
PPE measures how efficiently a fixture converts electrical energy into photosynthetically active photons. Current market benchmarks: below 1.8 µmol/J is below commercial viability; 1.8–2.2 µmol/J is entry commercial; 2.2–2.6 µmol/J is mid-tier commercial; 2.6–3.0 µmol/J is high performance; above 3.0 µmol/J is premium/state-of-the-art.
For vertical farms and large-scale CEA operations, any fixture below 2.5 µmol/J will face significant profitability challenges at current energy costs. Prioritize PPE as the primary efficiency metric in all RFQ specifications.
Uniformity
PPFD uniformity describes how evenly light is distributed across the coverage area. It is typically expressed as uniformity ratio: PPFD min ÷ PPFDavg (target: ≥0.8 for commercial production); or Coefficient of Variation (CV): Standard deviation ÷ Mean PPFD (target: ≤15% for commercial, ≤10% for research).
Low uniformity creates differential growth rates across a production zone — plants in low-PPFD areas under-yield while plants in high-PPFD zones may experience light saturation or stress. Both outcomes reduce overall area productivity.
Thermal Management
LED junction temperature directly governs both real-time output efficiency and long-term lumen maintenance. Thermal management evaluation should include thermal resistance specification (LED junction temperature
Wattage vs. PPFD — What Specs Actually Matter for Procurement?
Wattage tells you electricity consumption, but not photon output, spectrum, or uniformity. PPF tells you total photon output, but not spatial distribution or intensity at canopy. PPFD tells you intensity at a specific point, but not uniformity across coverage area. A PPFD Map tells you intensity distribution across area. PPE tells you efficiency of photon production. Spectrum data tells you wavelength distribution.
For procurement RFQ specifications, require: PPFD map at defined hanging height, PPE rating (µmol/J), spectrum graph, L70 lifespan data, IP rating, and thermal management documentation.
How to Decide Coverage Area and Calculate Hanging Height
Step 1: Define target PPFD for your crop and growth stage
Lettuce full cycle: 150–250 µmol/m²/s. Herbs full cycle: 200–400 µmol/m²/s. Cannabis vegetative: 400–600 µmol/m²/s. Cannabis flowering: 800–1,200 µmol/m²/s. Tomatoes fruiting: 600–900 µmol/m²/s.
Step 2: Calculate required PPF for your grow area
Required PPF (µmol/s) = Target PPFD × Area (m²). Example: 500 µmol/m²/s over 4 m² = 2,000 µmol/s required PPF.
Step 3: Calculate required number of fixtures
Number of fixtures = Required PPF ÷ Fixture PPF
Step 4: Verify hanging height from PPFD map
Use the manufacturer's PPFD distribution data to identify the hanging height that delivers your target PPFD across the required coverage area with acceptable uniformity.
What International Certifications Should I Prioritize?
For North American commercial operations: UL 8800 (horticultural lighting safety standard) and DLC Horticultural listing (requires independent third-party PPE testing; listed fixtures are typically required for utility rebate programs) are the most important certifications.
For European operations: CE marking with relevant EN standards is mandatory. Additional certifications include FCC Part 15, RoHS, IP65/66, ETL/cETL, and CB Scheme for mutual recognition of safety testing.
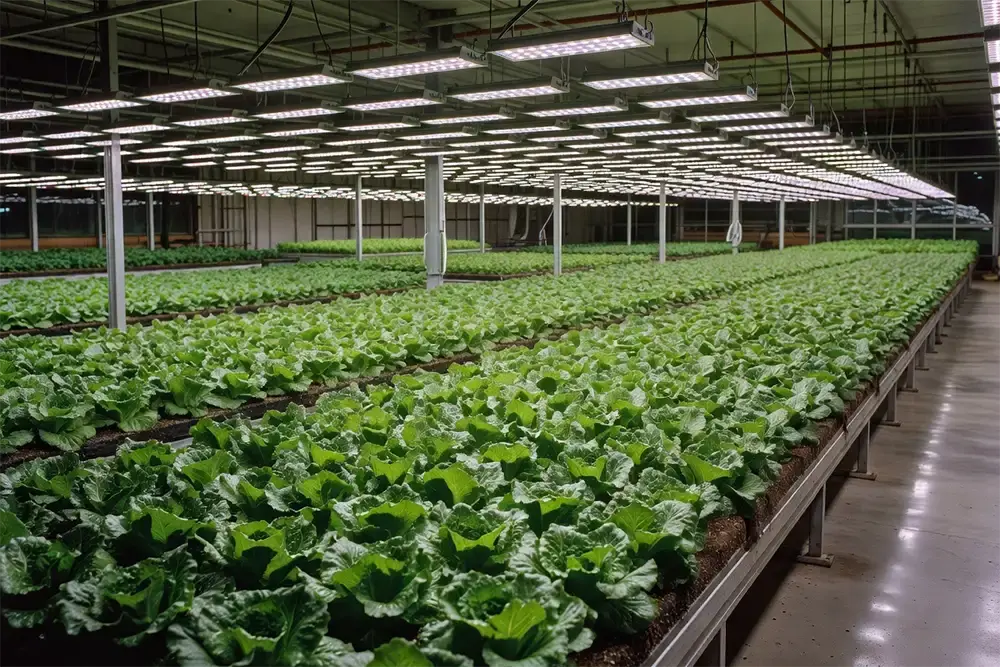
Commercial & Vertical Farm Applications for Full Spectrum LED Plant Grow Lights
Sole-Source vs. Supplemental Lighting Strategies
Sole-source lighting (100% artificial, no solar input): Used in indoor vertical farms, underground facilities, climate-controlled warehouses. PPE criticality is maximum — electricity is the primary operational cost. Requires full spectrum tuning across all growth stages and robust HVAC to manage heat load from lighting.
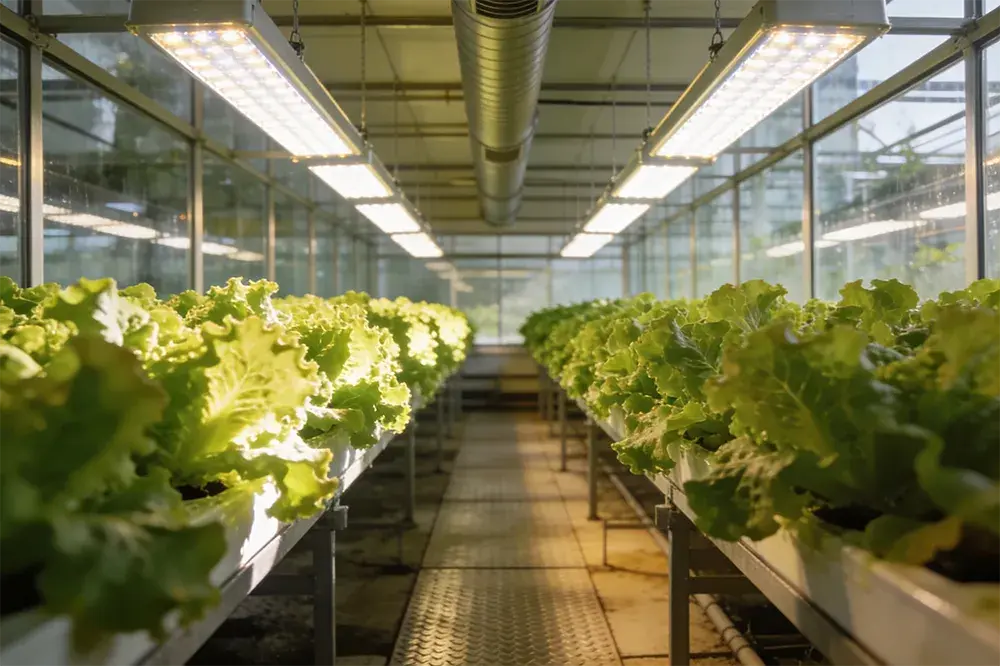
Supplemental lighting (artificial light supplements natural solar radiation): Used in greenhouses and multi-span growing structures. Dimming integration is essential — lighting systems must respond to real-time solar irradiance measurements. Infrastructure must accommodate corrosive greenhouse environment (humidity, fertilizer vapor).
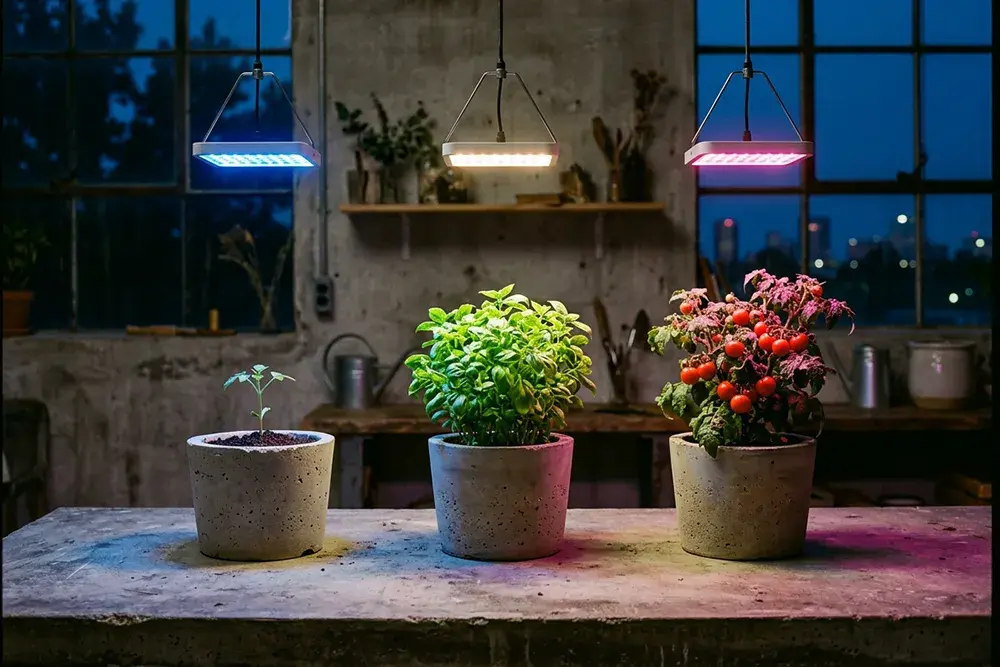
Crop-Specific Spectrum Requirements
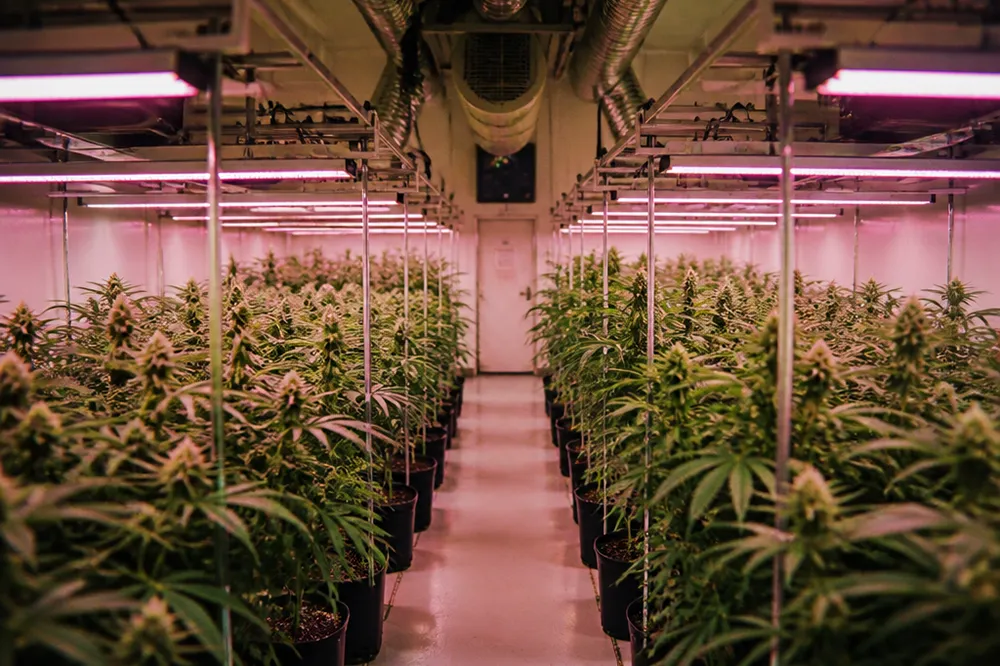
Cannabis:
Vegetative — blue-dominant (450–470 nm emphasis), PPFD 400–600, 18/6 photoperiod. Flowering — red-dominant (640–660 nm) + far-red (720–730 nm), PPFD 800–1,200, 12/12. UV-A supplementation in final 2–4 weeks for terpene and cannabinoid enhancement. CO₂ enrichment 1,000–1,500 ppm strongly recommended at high PPFD.
Leafy Greens (Lettuce, Spinach, Kale):
Full cycle balanced spectrum (blue:red 1:3 to 1:5), PPFD 150–300. Day-neutral photoperiod 16–20 hours. Green light inclusion important for visual quality and marketability.
Tomatoes:
Vegetative — balanced, moderate PPFD 300–500. Fruiting — high red + far-red, PPFD 600–900. Interlight systems recommended for high-wire production. DLI requirement: 20–30 mol/m²/day for commercial greenhouse production.
Cost Analysis for Your Plant Grow Light
Energy Savings: LED Plant Grow Lights vs. HPS/HID
Annual energy cost comparison per 1,000 µmol/s PPF delivered: HPS at 1.1 µmol/J requires 909W and costs approximately $717/year at $0.12/kWh. Entry LED at 2.0 µmol/J requires 500W and costs $394/year. Premium LED at 2.8 µmol/J requires 357W and costs $281/year. Top-tier LED at 3.2 µmol/J requires 313W and costs $246/year. Premium LED vs. HPS: 61% reduction in lighting energy cost per unit of photon output.
At 500 fixtures in a vertical farm, this represents approximately $218,000 in annual energy savings (HPS-equivalent system vs. premium LED), before accounting for reduced HVAC costs from lower heat output.
Lifespan, Maintenance Cost, and Payback Period
Total Cost of Ownership over 10 years per fixture: HPS initial purchase $200, lamp replacements $600 (5× over 10 years), lamp labor $250, annual energy $717 = 10-year total $8,220. Premium LED initial purchase $800, no lamp replacements or labor, annual energy $281 = 10-year total $3,610.
LED payback period: ($800 − $200) ÷ ($717 − $281) = 1.37 years. Within 14–17 months, the premium LED fixture pays back the upfront cost difference. The remaining 8.6 years operate at $436/fixture/year in energy savings.
Hidden Costs Often Overlooked in Initial Project Budgets
• Electrical infrastructure upgrade: panel upgrades or circuit reconfiguration if replacing high-current HPS systems
• Hanging hardware and mounting systems: typically $20–60 per fixture
• Controls and dimming infrastructure: $50–150 per fixture for commercial-grade systems
• Commissioning and calibration: $2–5 per square meter for commercial facilities
• Utility rebate application: professional engineering support may be required for DLC rebate programs
FAQ
Wattage measures electricity consumption — how much power your facility must supply to the fixture. PPE (µmol/J) measures how efficiently that electricity is converted into photosynthetically useful photons. Two fixtures consuming identical wattage can have dramatically different photon outputs if their PPE ratings differ. A 600W fixture at 2.8 µmol/J produces 1,680 µmol/s PPF. A 600W fixture at 1.8 µmol/J produces only 1,080 µmol/s PPF — 36% less usable light for the same electricity cost. At commercial scale over 50,000+ operating hours, this efficiency difference determines whether an operation is profitable. PPE is the metric that directly translates into cost per gram of yield and return on infrastructure investment.